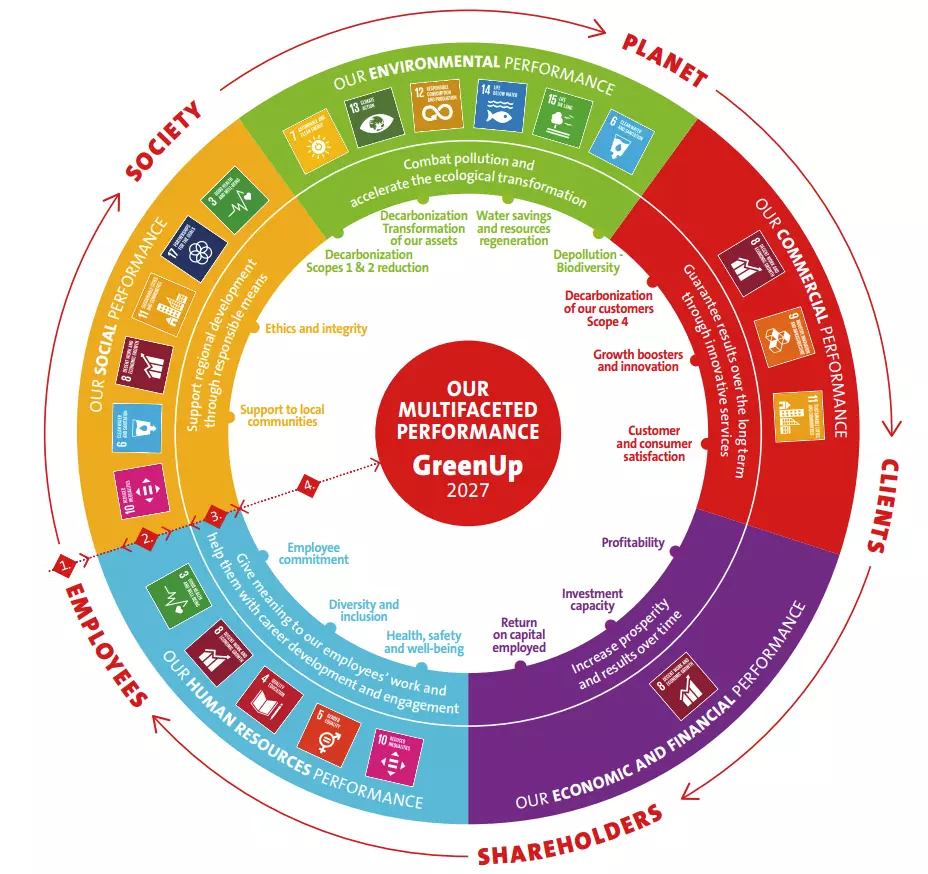
In its Purpose, Veolia expresses its aim to take stakeholder expectations into account when creating and sharing wealth. Accordingly, Veolia has committed to a multifaceted performance which takes into account the economic and financial, commercial, human resources, social and environmental performance.
UN Sustainable Development Goals (SDGs)
Veolia participates in the implementation of all 17 UN Sustainable Development Goals (SDGs), with a direct impact on 14 SDGs.
No poverty
Zero hunger
Good health and well-being
Quality education
Gender equality
Clean water and sanitation
Affordable and clean energy
Decent work and economic growth
Industry, innovation and infrastructure
Reduced inequalities
Sustainable cities and communities
Responsible consumption and production
Climate action
Life below water
Life on land
Peace, justice and strong institutions
Partnerships for the goals
15 priority objectives for multifaceted performance under GreenUp 2024-2027
| Dimension | Commitment | Objective pursued | Indicator - definition | 2023 baseline | Results 2024 | Results 2025 | 2027 Target |
| Commercial performance | Guarantee results over the long-term through innovative services | 1. Customer and consumer satisfaction | Customer satisfaction rate calculated using the Extended Net Promoter Score methodology (score and revenue coverage) (1) | Not applicable | NPS score = 55 with 81% of revenue covered | NPS score = 57 with 84% of revenue covered | NPS Score ≥ 30 with 80% of revenue covered |
| 2. Decarbonization of our customers – Scope 4 | Erased GHG emissions (new methodology) (2) | 13,45 Mt | +13 % vs 2023 | +23.6 % vs 2023 | +30 % vs 2023 | ||
| 3. Growth boosters and innovation | Revenue growth in priority business segments (Energy, Water Technology, Hazardous Waste) (3) | 12.032 billion € | +6.6 % | +8.6 % | CAGR ≥5% at constant energy prices and exchange rates, excluding divestitures planned at 01/01/24 | ||
| Environmental performance | Combat pollution and accelerate ecological transformation | 4. Decarbonization – scopes 1 and 2 reduction | Scopes 1 and 2 (4) GHG emissions reduction | 24.3 Mt of CO2 eq (Baseline 2021) | -14.5 % vs 2021 | -18.6 % vs 2021 | -18 % vs 2021 |
| 5. Decarbonization – transformation of our assets | Decarbonation Capex; Phase Out of coal and methane capture (cumulative 2024-2027) (5) | Not applicable | 133.5 M€ | 141 M€ | 600 M€ (cumulative 2024-2027) | ||
| 6. Fresh water saved and resource regeneration | Freshwater saved (reuse, desalination, leakage reduction) | 1.4 billion m3 | 1.45 billion m³ | 1.574 billion m³ | ≥ 1.5 Md m3 | ||
| 7. Depollution – biodiversity | Biodiversity preservation on sensitive sites | 59% progress on action plans (new scope) | 73% progress on action plans | 80% progress on action plans | ≥ 85% progress on action plans | ||
| Human resources performance | Give meaning to our employees work and help them with career development and commitment | 8. Health, safety and well-being | Lost time injury frequency rate (Veolia employees) | 4.95 | 4.33 | 4.11 | ≤ 4.1 |
| 9. Employee commitment | Employee commitment rate (Voice of Resourcers Survey) | 89 % | 88 % | 88 % | ≥ 85 % | ||
| 10. Diversity and inclusion | Proportion of women in the Group Management Committee | 25.6 % | 32.4 % | 37.1 % | ≥ 30 % | ||
| Social performance | Support regional development through responsible means | 11. Ethics and integrity | Positive answers to the ethics and compliance question in the “Voice of Resourcers” survey | 88 % | 86 % | 88 % | ≥ 83 % |
| 12. Support to local communities | Residents benefiting from inclusive solutions to access essential services (all activities) (6) | 7.8 million people | 8.4 million people | 9.2 million people | 8.4 million people (at constant scope) | ||
| Economical and financial performance | Increase prosperity and results over time | 13. Profitability | Current net income, Group share (7) | 1,335 M€ | 1,530 M€ | 1,643 M€ | CAGR ~10% (constant FX 2023) |
| 14. Investment capacity | Free Cash Flow (before discretionary growth Capex) (7) | 1,683 M€ | 1,819 M€ | 1,782 M€ | Annual target | ||
| 15. Return on capital employed | Post-tax ROCE (7) | 8.3 % | 8.8 % | 9.4 % | Annual target |
(1) In 2025, the methodology was applied and validated on 359 operational units, covering a revenue of €37 billion (84% of the total revenue amounting to €44.2 billion). The remaining 16% corresponds to entities that did not send surveys (calls for tenders in progress, contractual difficulties, etc.) or that sent surveys that did not meet the validation criteria.
(2) Scope 4, also called erased emissions, is a concept specific to Veolia, to assess the GHG emission reductions of third parties thanks to Veolia’s decarbonizing solutions. It is defined in point 4.1.2.1.4. Veolia ensures that scope 4 is recognized differently than its scopes 1, 2 and 3 emissions and may under no circumstances be subtracted from them.
(3) The definition of Growth Booster has been aligned with the GreenUp Booster definition.
(4) % reduction compared to the 2021 baseline restated according to the new allocation method, GHG emissions in scopes 1, 2 and 3.
(5) The indicator is calculated based on the initial investment budget for new forms of energy aimed at eliminating coal in Europe by 2030, that was estimated in 2023 at €1.65 billion.
(6) The methodology includes activities related to Water, Waste and Energy; the scope of the BUs / contracts includes the former Suez contracts.
(7) See the definition of financial indicators in Section 5.5 below.
Our commitments for multifaceted performance